01 The question
An atom can absorb two photons at once, jumping through a short-lived virtual state on the way. When the two photons are entangled, that absorption is far more likely than with ordinary light, and how it changes with the delay between the two photons reveals the material's virtual states: virtual-state spectroscopy. It works at very low light levels, which matters for living samples that bright lasers would damage.
The plan follows a scheme proposed by Svozilík and colleagues: delay one photon of each pair against the other and watch the two-photon absorption signal change. The target is caesium. Its 6S → 8S transition sits at 411.23 nm for two photons together, and is forbidden for one photon alone, so only pairs can drive it.
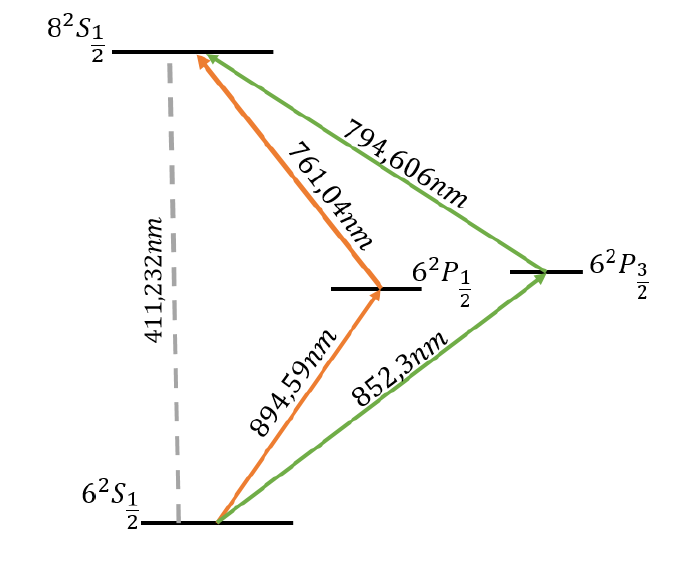
The thesis builds the first half of that experiment: a source of entangled photon pairs, its characterisation, and a delay line fine enough to see the two photons interfere.
02 Making photon pairs
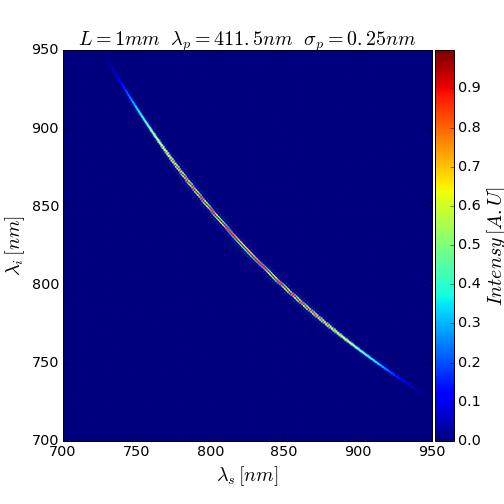
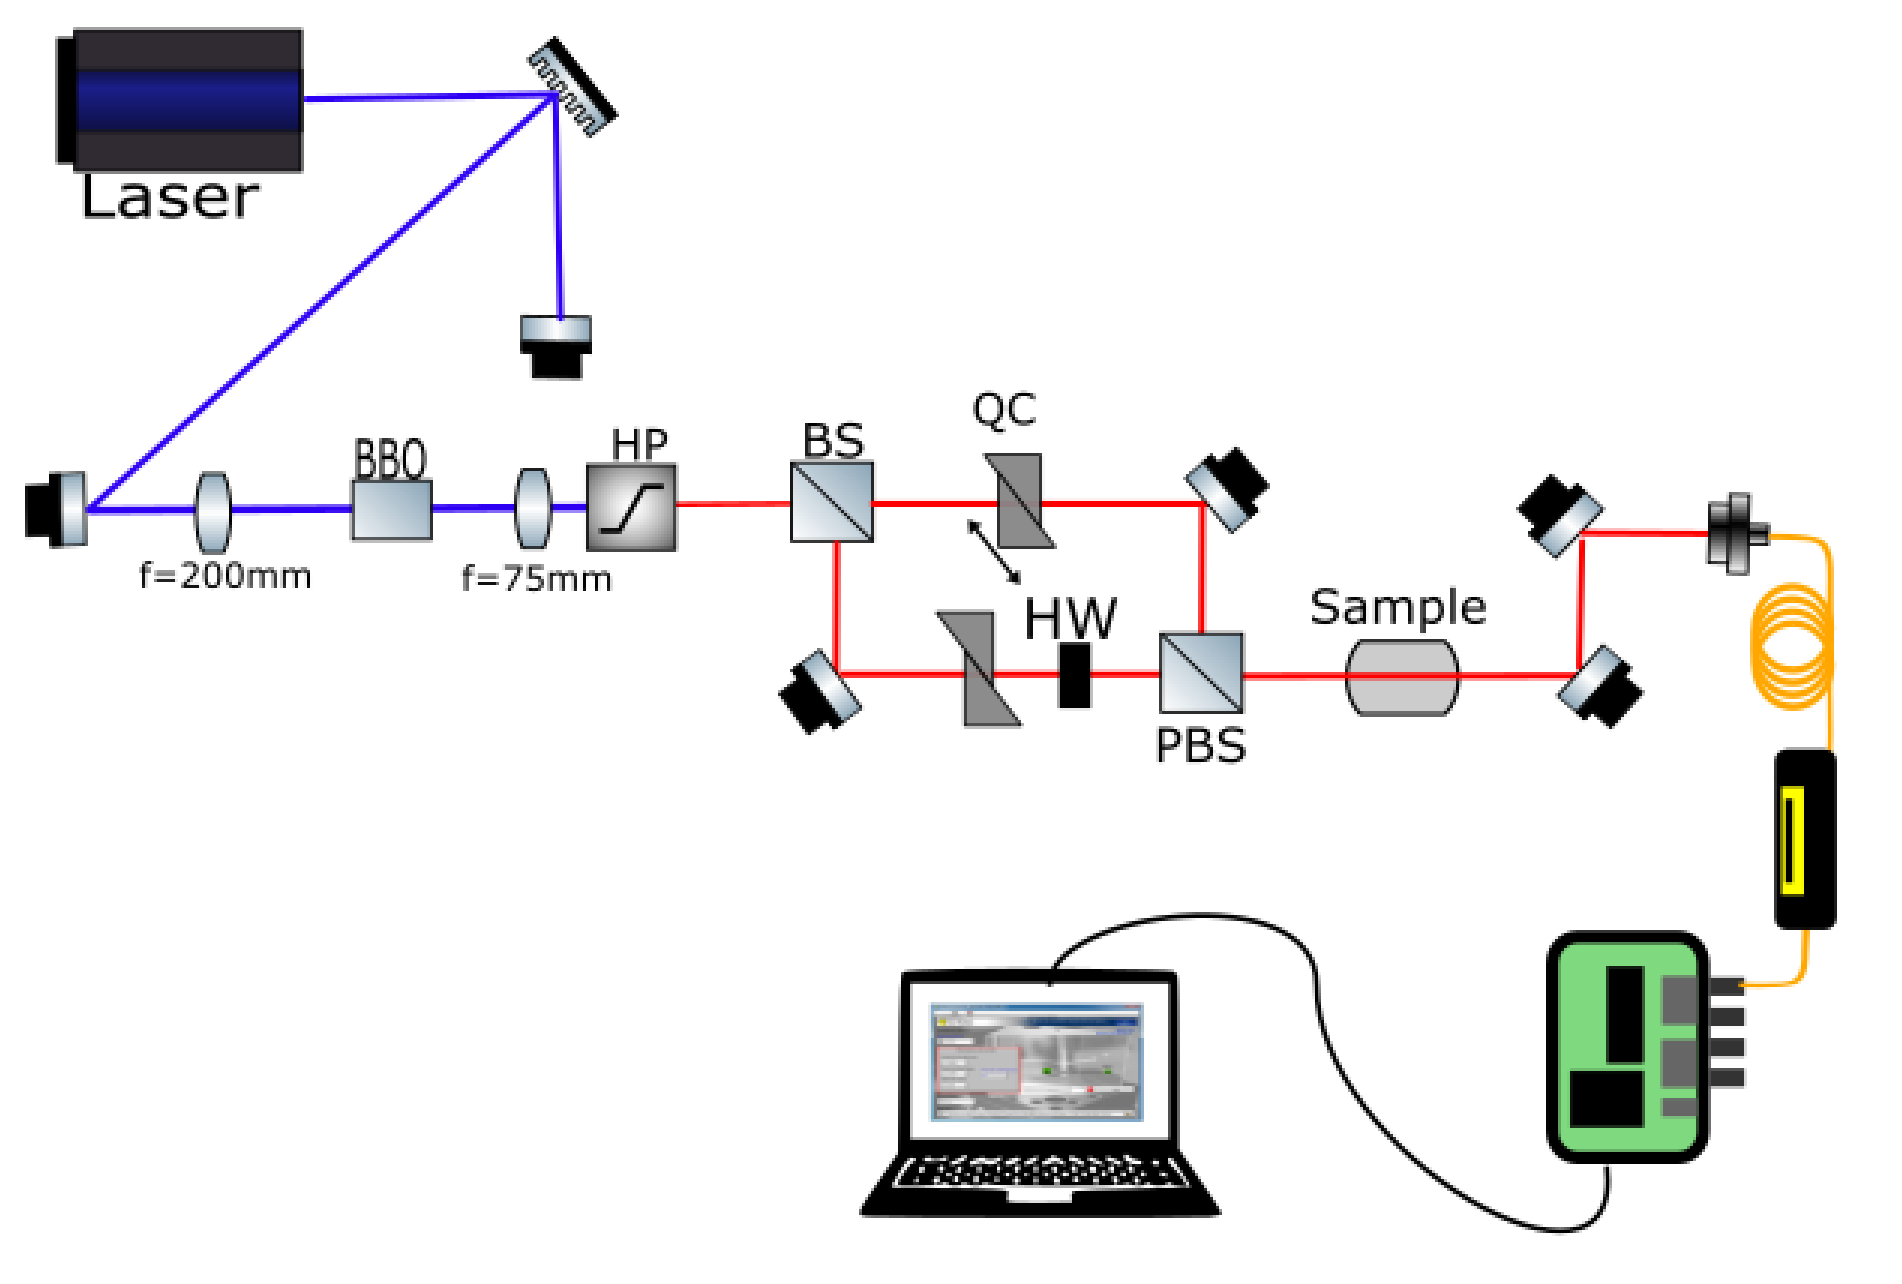
A violet laser at 411.33 nm pumps a 1 mm crystal of beta barium borate (BBO). Now and then a pump photon splits into two near-infrared photons that share its energy and momentum: spontaneous parametric down-conversion. For this crystal and pump, the pairs come out around 822 nm, with a calculated spread of ±130 nm that covers caesium's intermediate states.
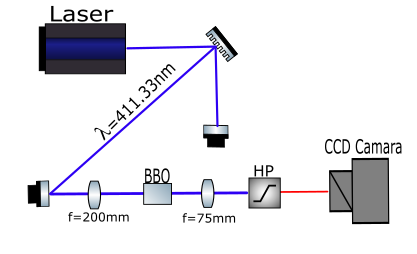
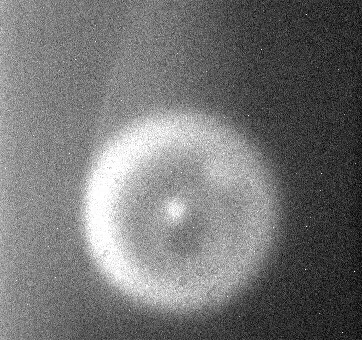
The pairs leave the crystal on a cone. Turning the crystal changes the cone's opening, from a single bright spot on the beam axis to a wide ring. The thesis keeps the collinear setting, where both photons travel along the pump beam.
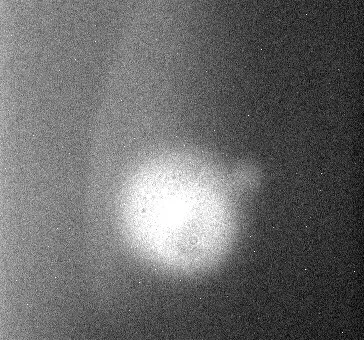
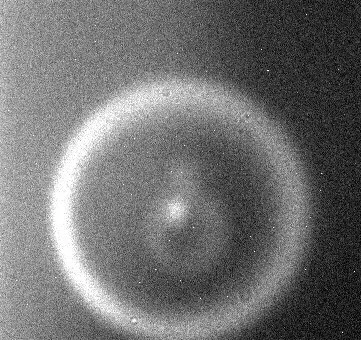
Pairs leave along the pump beam: one bright spot.
03 Are they really pairs?
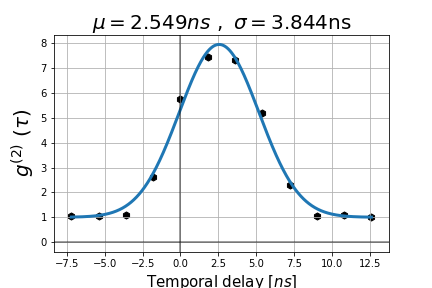
Two tests answer that. First, split the light onto two single-photon detectors and count coincidences against the delay between them: the second-order coherence, g². Pairs arrive together, so coincidences peak sharply, far above the level of uncorrelated light. The peak sits at 2.6 ns instead of zero, which shows the two detection arms are not equally fast; the thesis corrects for it in everything that follows.
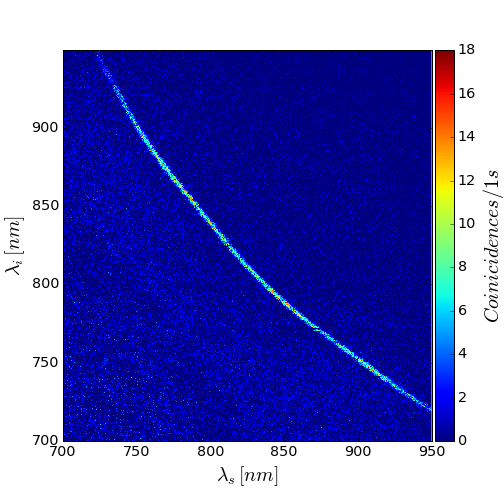
Second, the joint spectrum: which wavelengths arrive together. A monochromator in each arm selects one wavelength; one sweeps 700 to 950 nm in 0.5 nm steps while the other holds still, then the other moves on by 0.5 nm. Energy conservation forces a diagonal line: a shorter wavelength in one arm always pairs with a longer one in the other, symmetric about 822 nm.
 (full size, opens in a new tab)
 (full size, opens in a new tab)
04 Two photons, one beam splitter
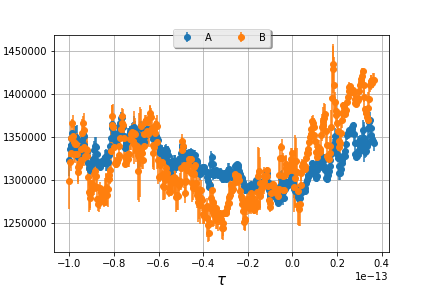
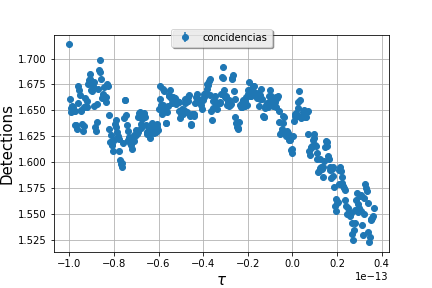
Send the two photons of a pair into the two sides of a beam splitter at the same moment and they always leave together, through the same side. Coincidences between the two outputs vanish: the Hong–Ou–Mandel dip, a purely quantum effect. Delay one photon and the dip fills back in. For a source this broad the dip is only a few femtoseconds wide, so measuring it calibrates the delay line itself.
The delay comes from quartz plates on translation stages: one set fixed, one tunable, so the delay can go negative as well as positive. One step of the stage adds 0.29 mm of quartz, 8.51 fs of delay; the finest setting adds 11.46 µm, 0.34 fs.
Y: coincidences, relative · X: delay between the photons, fs
- Coincidences
- 1.000
- Samples inside the dip
- 1
Show the numbers, coarse steps
| Step | Delay, fs | Coincidences |
|---|---|---|
| -2 | -17.02 | 1.000 |
| -1 | -8.51 | 1.000 |
| 0 | 0.00 | 0.000 |
| 1 | 8.51 | 1.000 |
| 2 | 17.02 | 1.000 |
 (full size, opens in a new tab)
 (full size, opens in a new tab)
Over the measurement the single-photon counts varied within σ = 23k detections in arm A and 42k in arm B; light that does not arrive at a constant rate makes the coincidences fluctuate and the dip harder to distinguish, so the thesis calls this first measurement not conclusive.
05 Key figures
| Parameter | Value | Unit |
|---|---|---|
| Pump laser | 411.33 | nm |
| Caesium 6S → 8S, two-photon | 411.23 | nm |
| Nonlinear crystal, BBO, type-I collinear | 1 | mm |
| Pair wavelength, degenerate | 822 ± 0.5 | nm |
| Pair bandwidth, calculated | ± 130 | nm |
| Detector arm offset, from g² | 2.6 | ns |
| Joint spectrum scan, both arms | 700 to 950 | nm |
| Delay step, quartz plate | 8.51 | fs |
| Finest delay step | 0.34 | fs |
The thesis text gives 411.32 nm; its Fig. 1.1 gives 411.232 nm, used here.
06 Result
The source works. The photon pairs leave the crystal along the pump beam, arrive together at two detectors, and have a joint spectrum symmetric about 822 nm that matches theory and covers the wavelengths caesium needs. A quartz-plate delay line with femtosecond steps is set up as a first approach to the Hong–Ou–Mandel measurement; calibrating it finely is the step before placing a sample in the beam.
07 Where it leads now
The lab taught me order: a clear concept, a careful attempt, an honest assessment, then another try. Experimenting was allowed, as long as it was done with care. And the light was visible. You put a crystal in the beam and watch new light come out; you can measure it, deflect it and judge how clean the beam is, with your own hands. With a laser and a crystal we measured correlations between pairs of photons and saw the theory for that crystal hold.